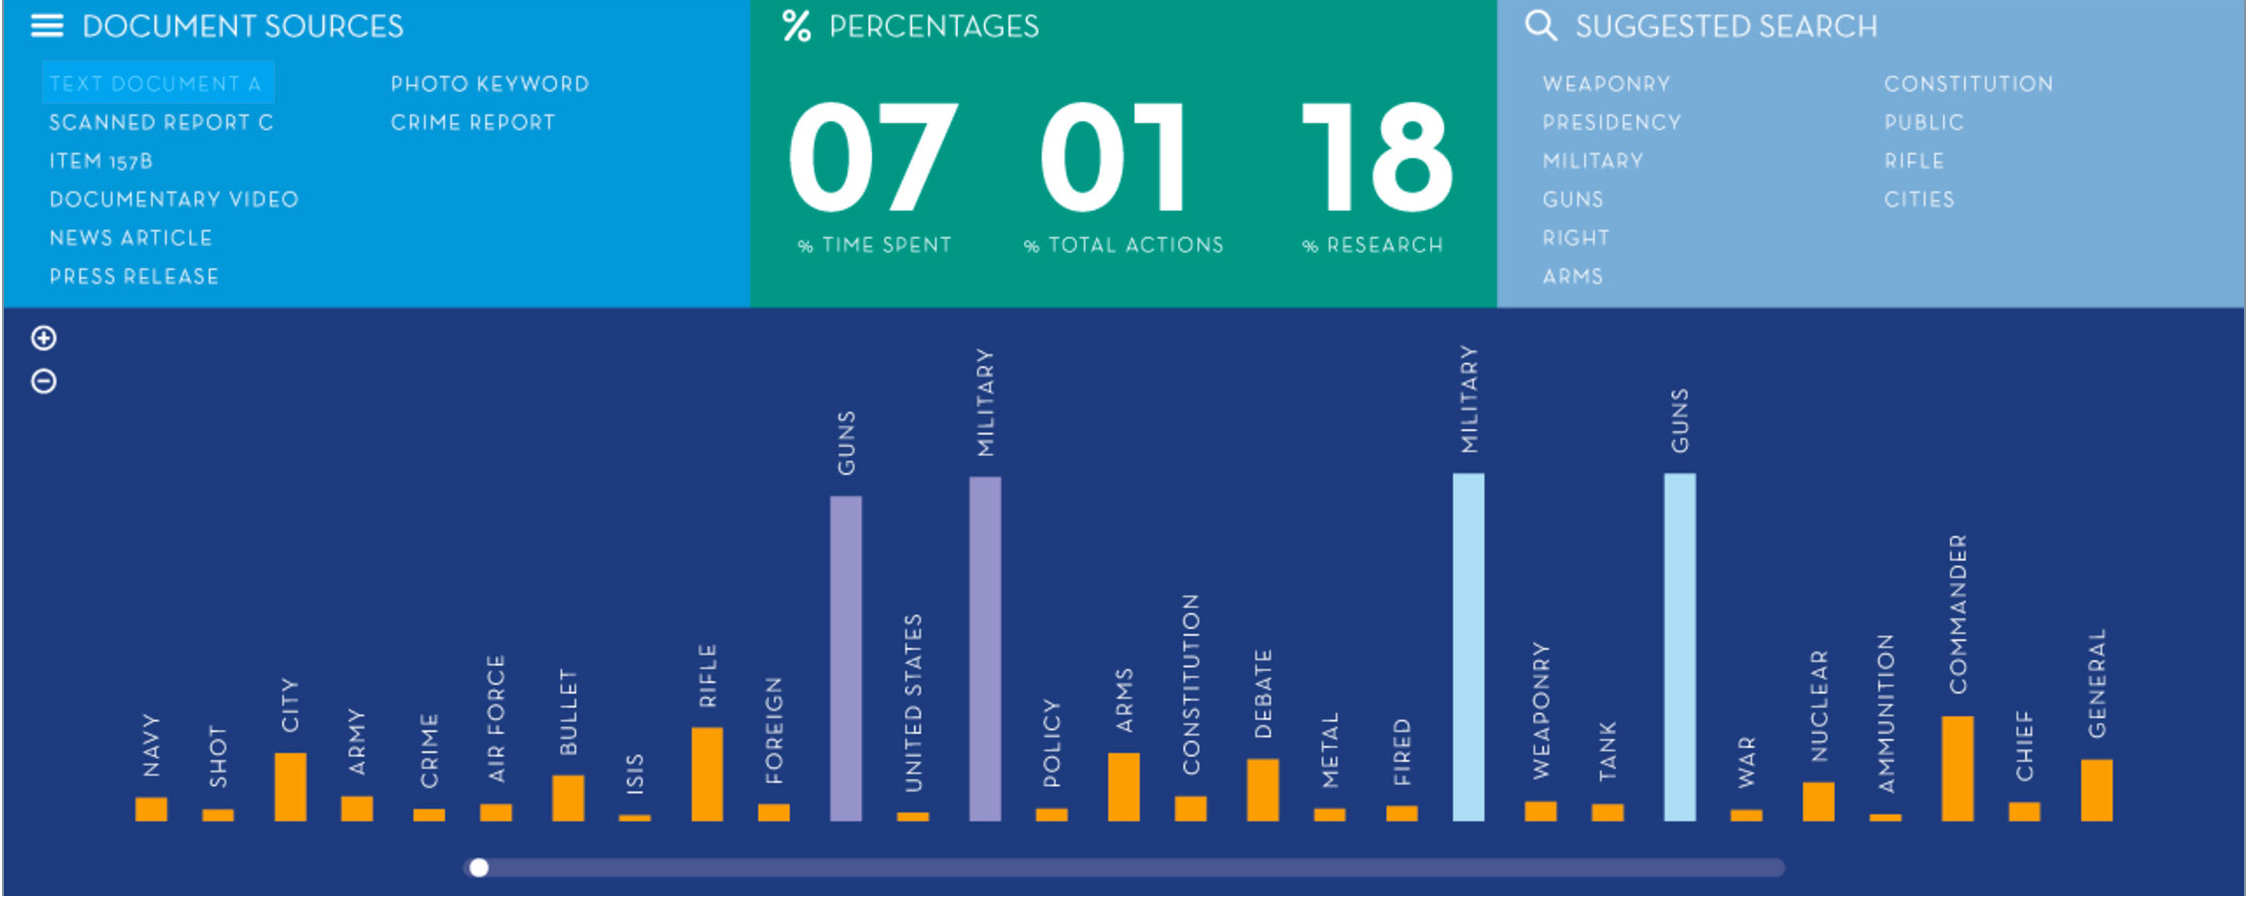
A visual representation created by undergraduate students working with visualization professors Anatol Bologan, Donna Hajash, and Eric Ragan to determine the best way to depict complex data analyses.
Prof investigating best way to visualize data-driven decisions

Eric Ragan
Decision-making based on large, complex and often unwieldy datasets is a perplexing process that Eric Ragan, professor of visualization at Texas A&M University, is working to illuminate through visualization.
“I’m exploring how visualization design can best serve to create different kinds of visual timelines that will let anyone understand how a data analysis-based decision was made,” said Ragan, who is heading the two-year, $175,000 project funded by the [National Science Foundation] (https://www.nsf.gov) .
Visualized timelines showing the multiple steps taken in a data analysis project can facilitate group projects should a new member join the analysis team and demonstrate to other groups the steps the team took to arrive at a conclusion.
“Let’s say that Roberta, a safety program manager with a petroleum refining organization, decided after analyzing several large expense and safety incident datasets that her company would save money over time by increasing equipment inspections,” said Ragan. “In this scenario, if Roberta’s supervisor wants to know how she arrived at her decision, it’s important for her to explain not just her decision, but the steps in her analysis,” he said.
The high complexity of some data analyses makes it difficult to retrace steps and determine the rationale that prompted conclusions.
“An effective visual representation of an analysis process, known as analytic provenance," Ragan said, "is essential to understand analytics strategies and the decisions they’re based on, but creating this kind of visualization takes extensive design work.”
There are tools that provide such visualizations, he said, but there has been little research investigating their effectiveness.
For this project, Ragan and fellow visualization faculty Anatol Bologan and Donna Hajash are monitoring the performance of visualization and computer science students as they perform analyses with sample data and generate visualization designs illustrating the steps of their analyses.
Additionally, he is developing new methods for assessing the effectiveness of specific visual elements within provenance visualizations and looking for ways to automatically generate the illustrations.
Tags
Related Posts

Micro-manufacturing initiative earns NSF Convergence Award

Teacher 'making’ workshop fosters STEM education

Oct. 23 symposium spotlighted college, faculty research


Viz prof to learn if storytelling aids science learning
Follow Us
Facebook Twitter Vimeo Youtube Flickr RSS
Recent Posts


Planning prof heads study of disaster housing aid

A message from the dean


_thumbnail_small.png)

Former student remembered as expert planner


Leading educator named new head of Architecture Dept.
